Mean vs Median vs Mode: How to Calculate Each (With Examples)
The mean is the sum of all values divided by how many there are. The median is the middle value once they are sorted. The mode is the value that appears most often. All three are "averages", and they can give very different answers for the same data. Here is how to calculate each, and how to pick the right one.
How to calculate the mean
Add every value, then divide by the number of values.
Mean = sum of values ÷ number of values
Example: test scores of 72, 85, 90, 64 and 89. The sum is 400, there are 5 scores, so the mean is 400 ÷ 5 = 80.
The mean uses every data point, which is its strength and its weakness. It reflects the total exactly: 5 scores averaging 80 always add up to 400. But a single extreme value can drag it far from what is typical.
How to find the median
- Sort the values from smallest to largest.
- If there is an odd number of values, the median is the middle one.
- If there is an even number, the median is the mean of the two middle values.
Odd example: 64, 72, 85, 89, 90. The median is 85.
Even example: 3, 7, 8, 12. The two middle values are 7 and 8, so the median is (7 + 8) ÷ 2 = 7.5.
A quick way to find the middle position in a sorted list of n values is (n + 1) ÷ 2. For 5 values that is the 3rd. For 4 values it is 2.5, meaning halfway between the 2nd and 3rd.
How to find the mode
Count how often each value appears. The most frequent is the mode.
- 2, 4, 4, 5, 7: the mode is 4.
- 1, 3, 3, 6, 6, 9: two modes, 3 and 6 (bimodal).
- 1, 2, 3, 4: no mode, because every value appears once.
The mode is the only average that works for non-numeric data. You cannot take the mean of shirt sizes, but "medium" can be the mode.
One data set, three answers
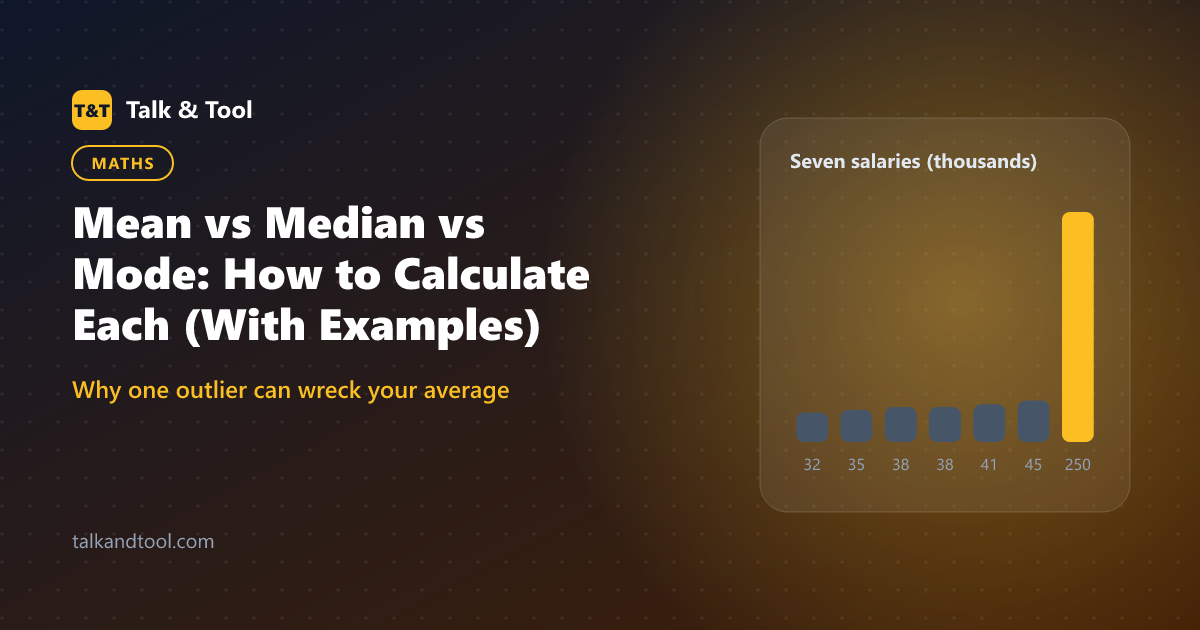
Here is where the choice matters. Seven people's salaries: 32k, 35k, 38k, 38k, 41k, 45k and 250k.
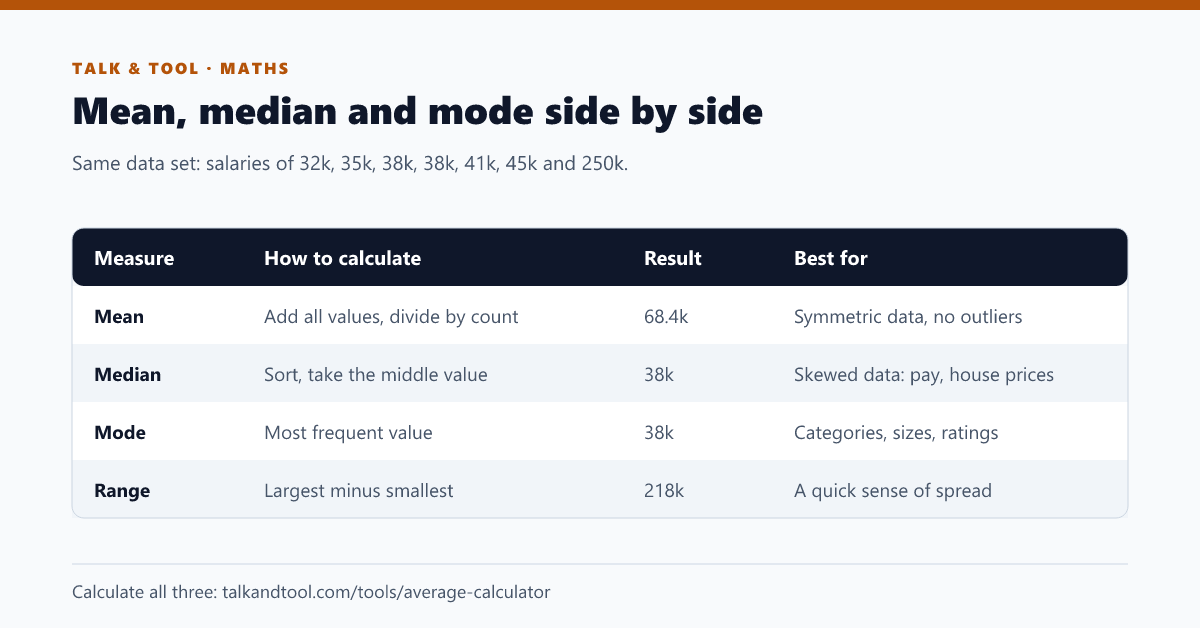
The mean is 479k ÷ 7 = 68.4k, higher than six of the seven salaries. The median and mode are both 38k, which describes the typical person far better. That is why income, house prices and wealth are almost always reported as medians: a few very large values would make the mean misleading.
Which average should you use?
- Use the mean when the data is roughly symmetric with no extreme values, such as heights, exam scores in a large class, or manufacturing measurements. Also use it when the total matters: average spend per order × orders = revenue.
- Use the median when the data is skewed or has outliers, such as incomes, prices, response times and delivery times. For website performance, the median load time better describes a typical visit, while high percentiles describe the slow tail.
- Use the mode for categories and discrete choices, such as the most common shoe size, the most chosen product option, or the most frequent rating.
When the mean and median are far apart, that gap itself is informative: it tells you the data is skewed. Mean well above median means a long tail of high values.
Weighted mean
When values count differently, multiply each by its weight, add, then divide by the total weight. A course graded as coursework 40% (score 75) and exam 60% (score 62): (0.4 × 75) + (0.6 × 62) = 30 + 37.2 = 67.2. The same method drives GPA calculations, covered in how to calculate GPA on a 4.0 scale, and final-grade planning, covered in what score do I need on my final exam.
Calculating them quickly
For a handful of numbers, the steps above take seconds. For longer lists, paste them into the average calculator, which returns the mean, median, mode, range and standard deviation at once, from numbers pasted in any format. In a spreadsheet, the functions are =AVERAGE(), =MEDIAN() and =MODE.SNGL() (or =MODE.MULT() for several modes).
If you are comparing how much two averages have changed, the percentage calculator and our guide to percentage increase and decrease cover the next step.
Frequently asked questions
Is the average the same as the mean?
In everyday use, "average" usually means the mean. Strictly, mean, median and mode are all types of average.
Can the median be a number not in the data?
Yes. With an even number of values, the median is halfway between the two middle ones, so it may not appear in the list (7.5 in the example above).
What if there is no mode?
If every value appears once, the data set has no mode. That is common with continuous measurements like weights or times.